Lecture
Normalization
Normalization
- Good table structures
- Controls data redundancies
- Avoids modification anomalies
What is Database Normalization
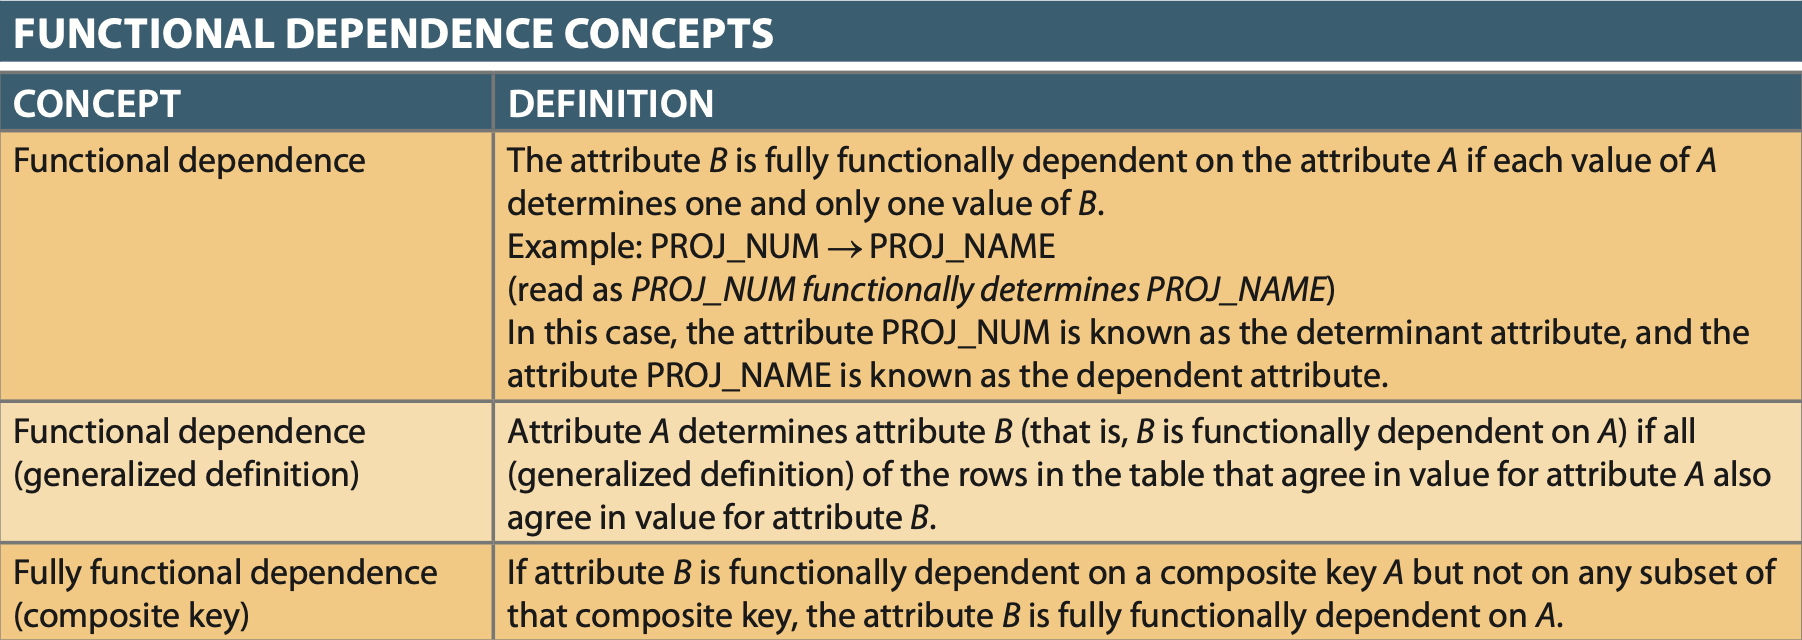
Definition
- Normalization: Finding and fixing table structure errors, which eliminates redundancy and reduces data anomalies.
- With normalization key attributes are called prime attributes and nonkey attributes are called non-prime attributes
Normalization Goals
- Each Table/Relation represents a single subject.
- Each attribute (row/column intersection) contains only a single value (not a group of values).
- Controlled and minimum data redundancy, a value is not unnecessairily duplicated in other tables.
- All non-prime / nonkey attributes are dependent on the primary key (ensures data is unique to PK).
- There is no Table/Relation where a Insert, Update, or Delete can cause a data anomaly (ensures data integrity)
Basic Process
- Assign table attributes based on determination and functional dependency discussed in Chapter 3 to build ERD.
- Identifying business rules
- Identifying and defining business and data constraints
- Defining functional dependencies
- Identifying entities and relationships
- Eliminating multivalued attributes
- Normalization is then applied to analyze ERD and determine if structure can be improved.
- The process is applied in steps from 1NF to 3NF, which is usually good enough.
- There are legitimate reasons to violate 3NF and higher forms, however. So 3NF is not always optimal.
- 3NF engenders the need for more tables, therefore more joins and more Compute/Memory resources.
- Performance / Anomaly-Redundancy trade off is often a concern.
- Designers denormalize and compromise anomalies for performance.
- 3NF engenders the need for more tables, therefore more joins and more Compute/Memory resources.
- Most of the time designers are asked to use normalization process to anaylze and rectify existing files, spreadsheets and data structures.
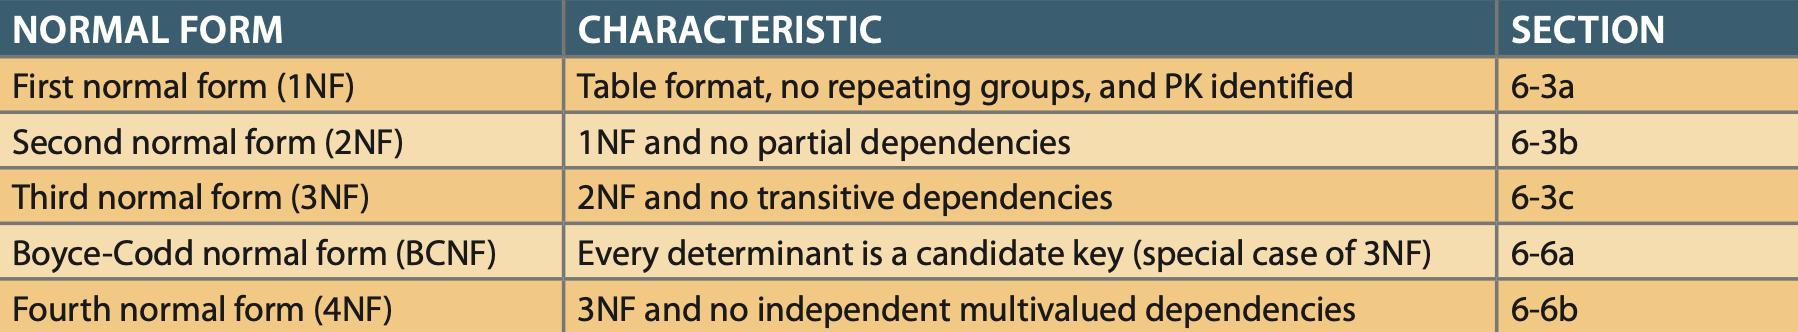
Normal Forms, Low to High Transforms
- Partial Dependency: (A, B) (C, D), B C, and (A, B) is the PK then B C is a partial dependency since its only partially dependent on the PK.
- Transitive Dependency: X Y, Y Z, and X is the PK then X Z is a transitive dependency because X has a path directly to Z.
- Transitive dependencies occur only when a functional dependence exists among nonprime attributes (i.e. Y -> Z because Y is non-prime).
Unnormalized/Raw data
- Will often contain redundant data, multivalued data, and other data anomalies like data integrity and data inconsistency
1NF
- All of the key attributes are defined.
- There are no repeating groups in the table. In other words, each row/column intersec- tion contains one and only one value, not a set of values.
- All attributes are dependent on the primary key.
1NF Steps:
- Split grouped attributes into there own rows (i.e. for a row with grouped column of EmpIDs 1,2,3,… the row would be duplicated for each ID in the column EmpIDs.
- A Primary Key should be identified (i.e. for raw data it must be a set of attributes that combined identifies each row uniquely).
- Identify ALL dependencies using a dependency diagram like below:
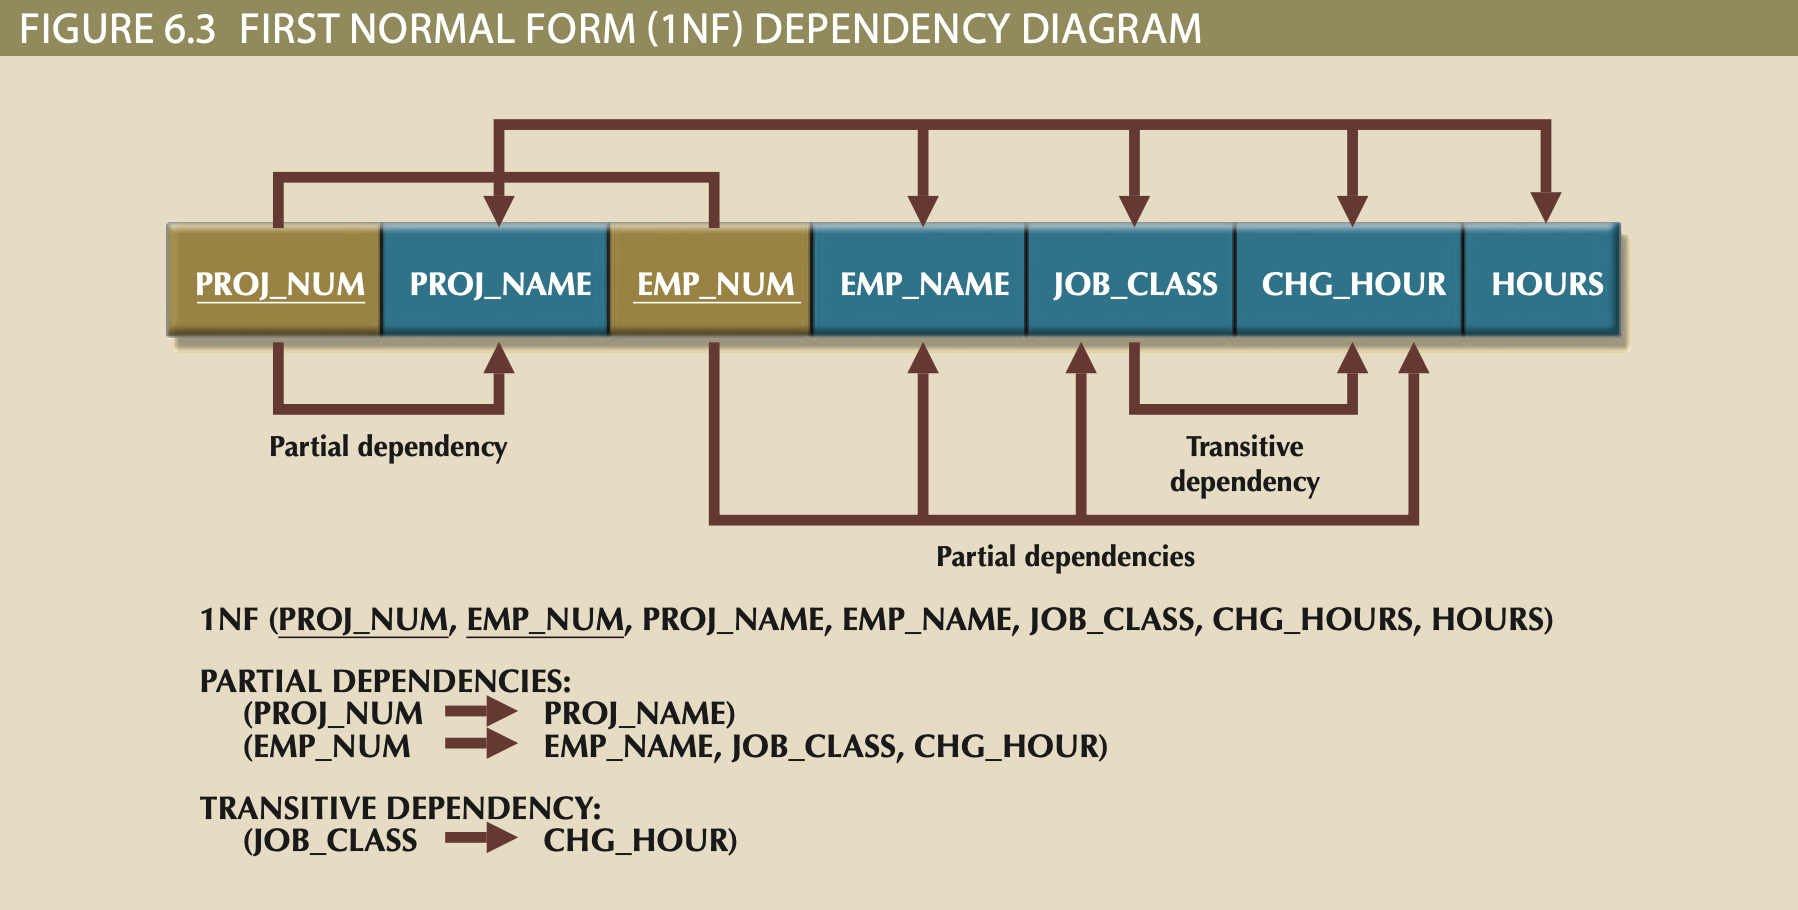
Dependency
- PK is Bold, Underline, and Colored
- Top arrows are dependencies based off PK
- Bottom arrows indicate Partial and Transitive dependencies
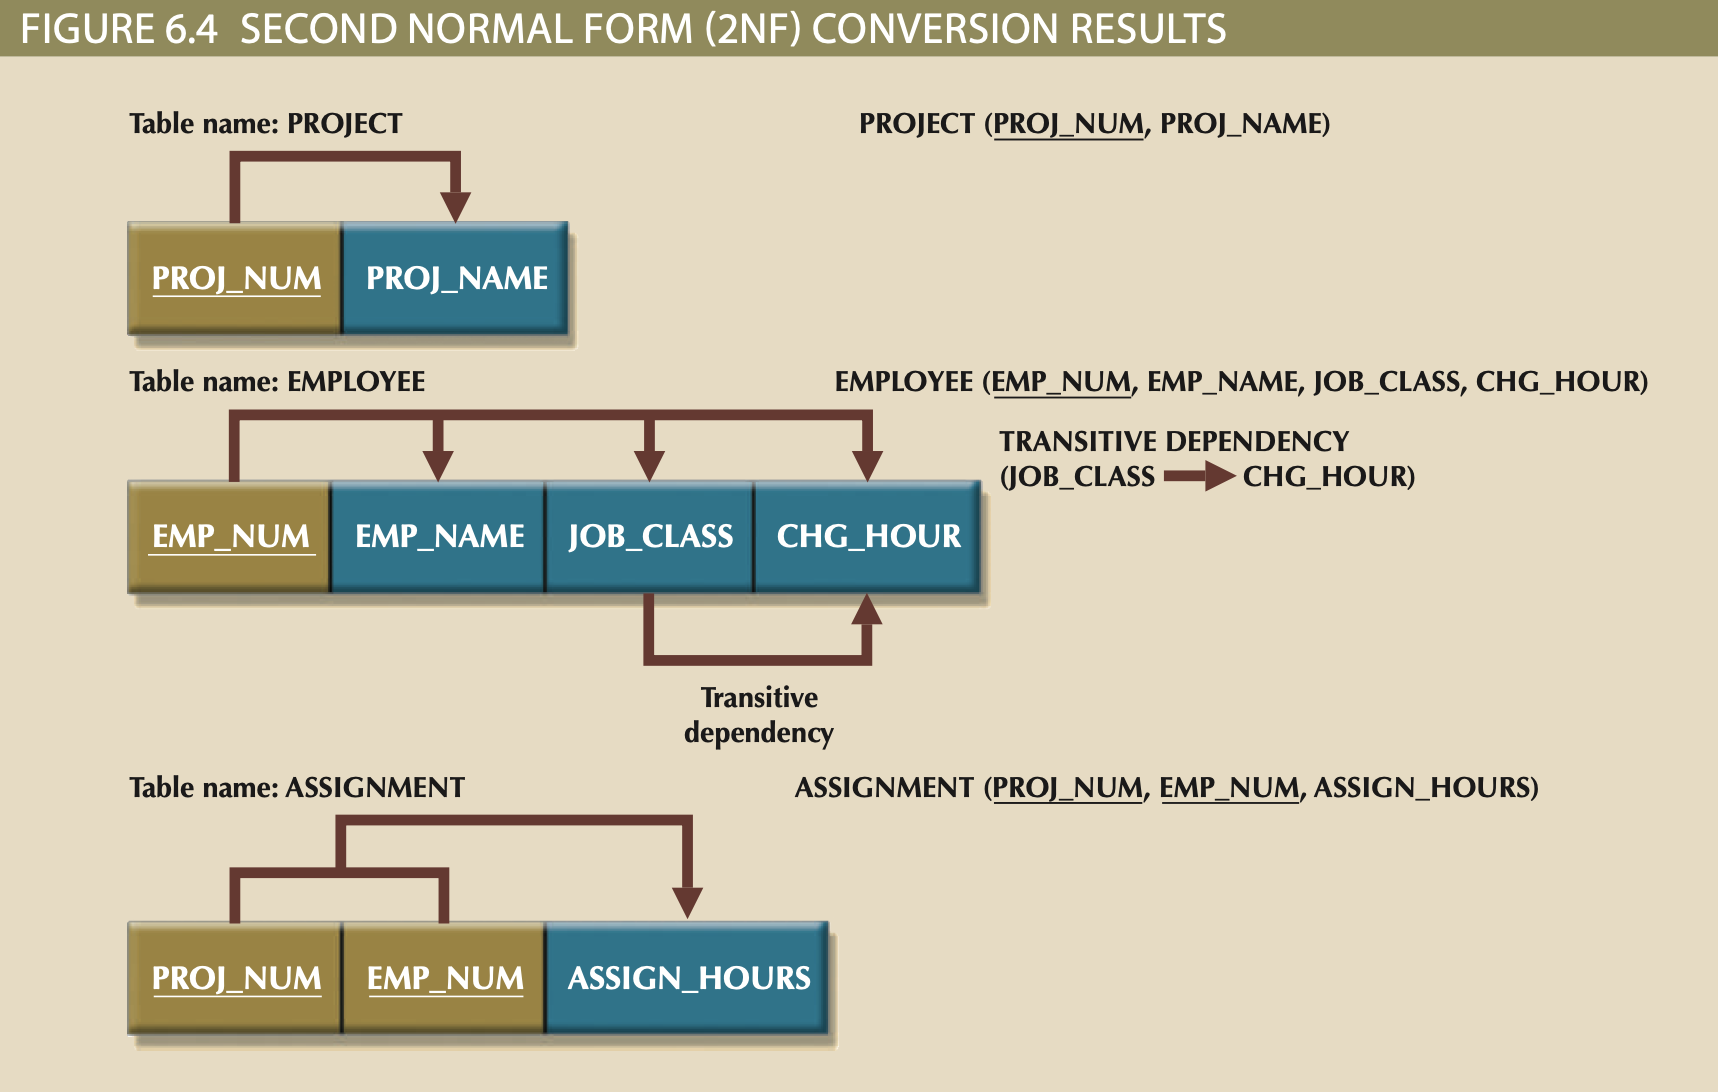
2NF
- If 1NF has non-Composite PK, Table/Relation is already in 2NF
- It is in 1NF.
- It includes no partial dependencies; no attribute is dependent on only a portion of PK.
- Transitive dependencies may still exist.
2NF Steps:
- Eliminate Partial Dependencies
- Create new Tables/Relations from each parital PK (partial PK becomes PK of new table)
- Leave partial PK/determinant attribute in original table as FK.
- Use 1NF dependency diagram to reassign dependent attributes of Partial PK
- Dependent attributes are moved to corresponding new table.
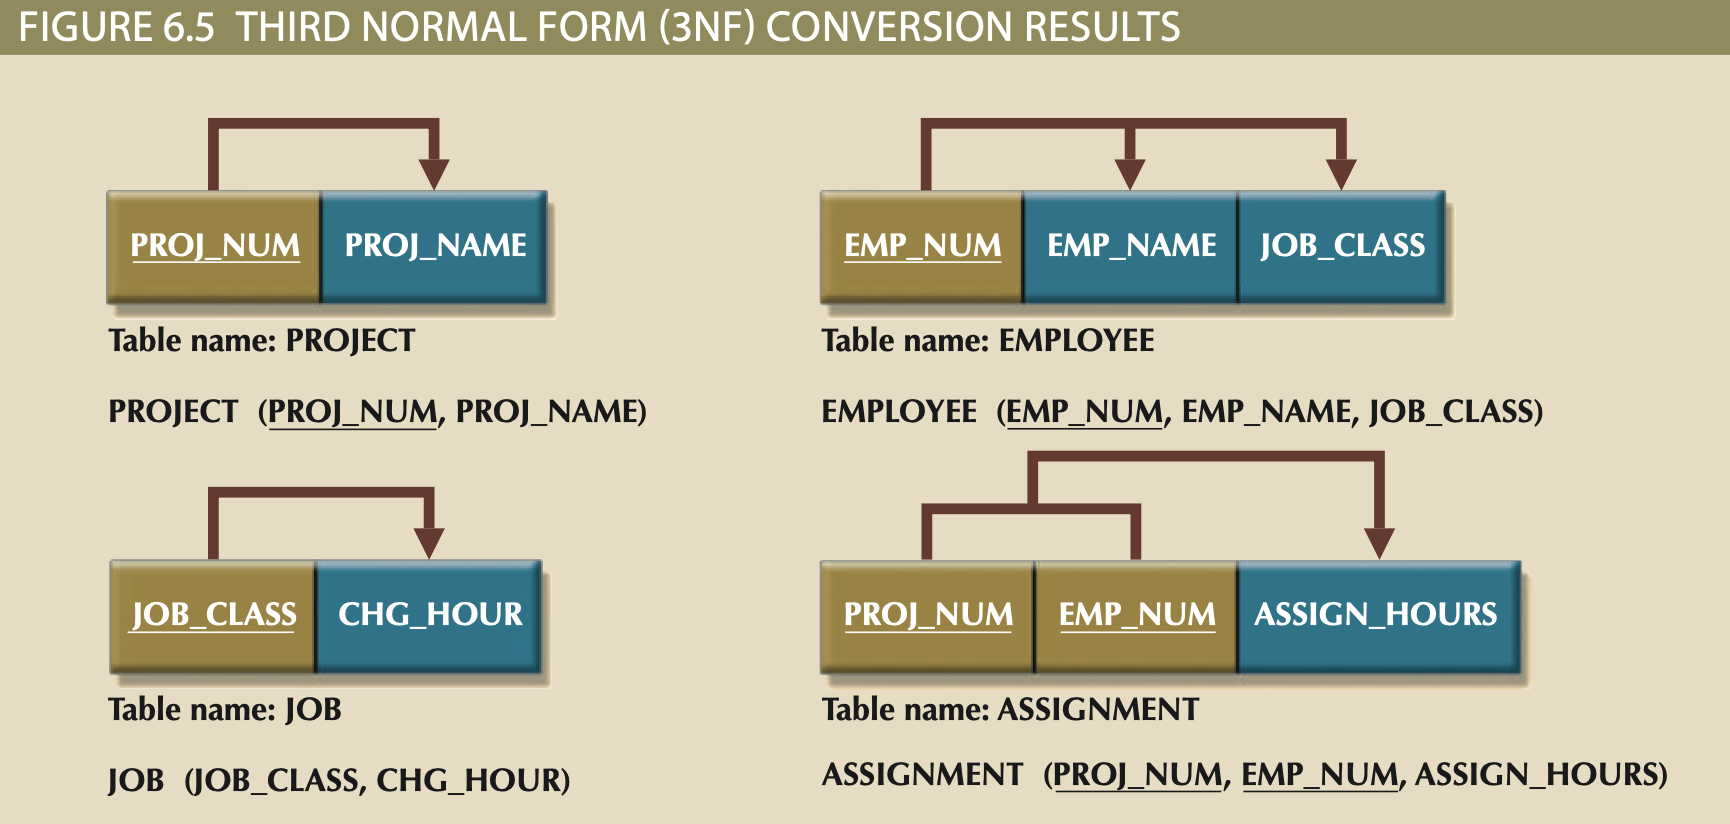
3NF
- It is in 2NF
- It includes no transitive dependencies.
3NF Steps:
- Make new Tables/Relations to eliminate transitive dependencies.
- Create new Tables/Relations from each Transitive determinant (determinant becomes PK of new table)
- Leave determinant attribute in original table as FK.
- Use 2NF dependency diagram to reassign dependent attributes of Transitive determinant.
- Dependent attributes are moved to corresponding new table.
Multiple
The steps above are slightly complicated when a table has multiple candidate keys because the designer will need to pick one to become the PK. Identifying the candidate keys is still essential, however because composite candidate keys will still indicate partial dependencies, and likewise candidate keys are a sign that transitive dependencies may NOT exist since a transitive dependency requires the determinant attribute to be non-prime (i.e. not a part of any key and determined by a key).
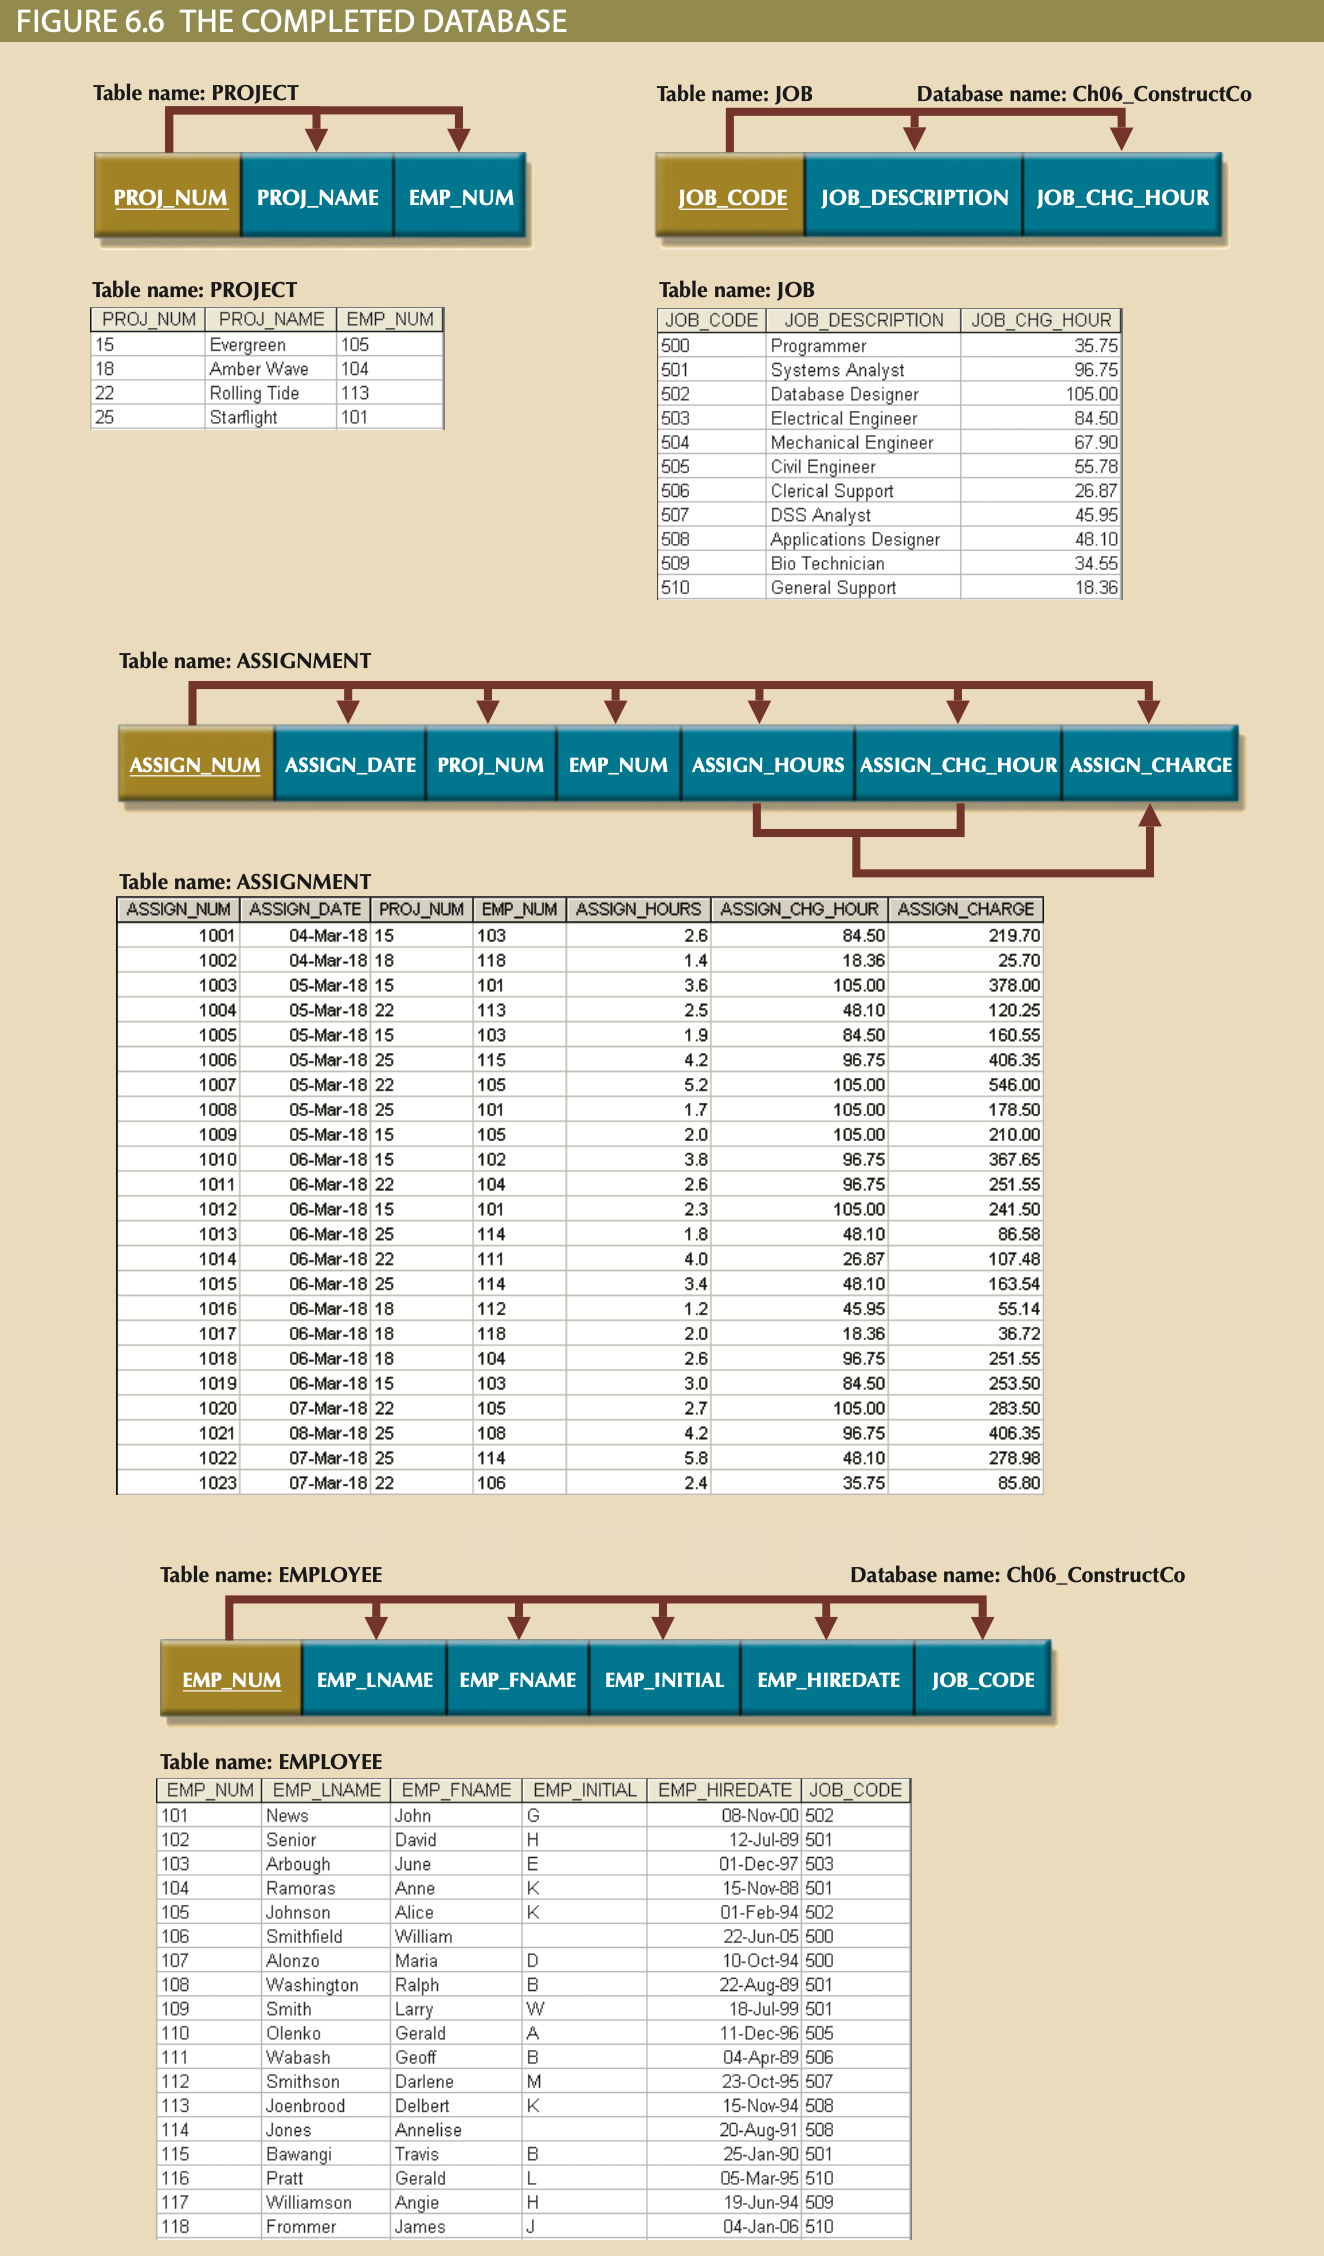
Additional Steps
- Evaluate PK Assignments: Make sure the primary keys for each table make sense (e.g. use IDs/Codes instead of data entry items like Names for PKs
- Evaluate Naming Conventions: Make sure all attributes follow the DB naming conventions like Table prefix, all caps, and column names that clearly identify the purpose of the attribute.
- Refine Attribute Atomicity: Decompose attributes like Name into FIRST_NAME and LAST_NAME to abet query flexibility.
- Identify New Attributes: Add attributes that may be missing but necessary for fulfilling business rules.
- Identify New Relationships: If business rules ask for Table A to be related to Table B (i.e. Manager to Project, etc.), make sure such relationships exist.
- Refine Primary Keys as Required for Data Granularity: E.G. Make sure attributes like HOURS are defined within a timeframe and determine if multiple HOURS row entries should be allowed. If so, a surrogate key or posibly even another Table/Relation may be needed.
- Maintain Historical Accuracy: Make sure attributes like LINE_PRICE and ITEM_PRICE exist in appropriate tables if historical accuracy is necessary. In the example, LINE_PRICE would never change, but ITEM_PRICE might.
- Evaluate Using Derived Attributes: Make sure to add columns for derived attributes based on compute and performance needs.
- Clean up Composite Keys: Composite keys can become cumbersome by making foreign keys difficult or searches by PK more difficult, thus clean them up with surrogate keys, but make sure to:
- Replace composite key with a surrogate and add any unique indexes to ensure data integrity.
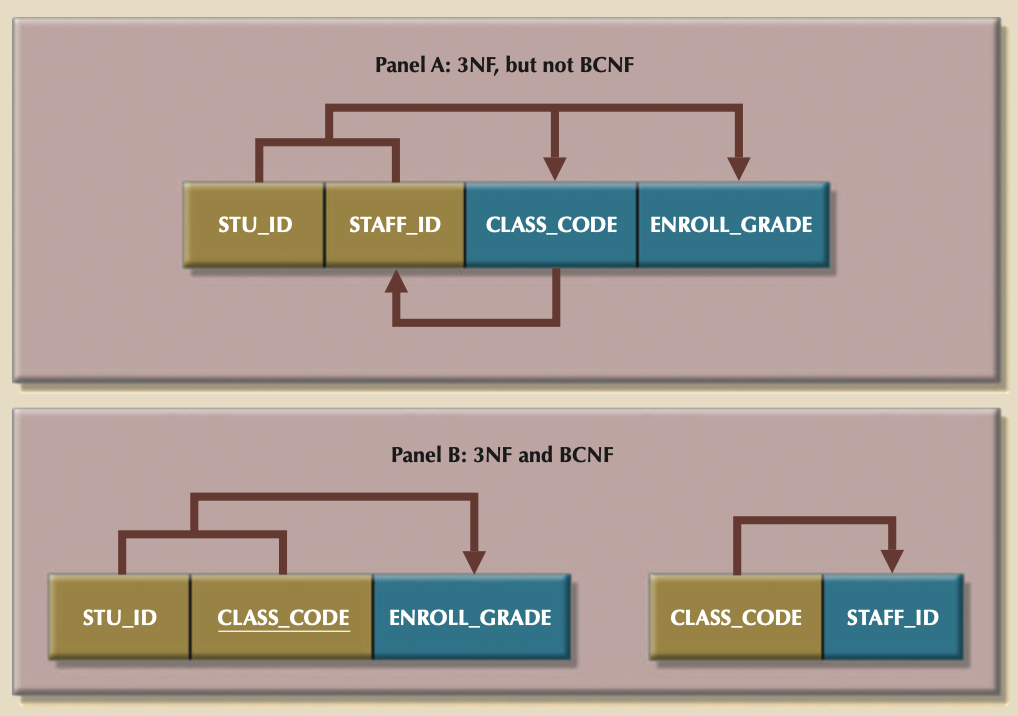
Boyce-Codd Normal Form (BCNF)
- A table is in Boyce-Codd normal form (BCNF) when every determinant in the table is a candidate key.
-
A 3NF Table/Relation only violates BCNF if it has multiple candidate keys.
-
Example below is in 3NF because what looks like a transitive dependency is actually a dependency between candidate keys. Thus, it violates BCNF, but not 3NF.
4NF
- A table is in fourth normal form (4NF) when it is in 3NF and has no multivalued dependencies.
- 4NF may be necessary if you have a table with 2 or more multivalue dependencies/attributes, independent from eachother, but dependent on what would be a single key. E.g. An EMPLOYEE with multiple ORG_CODE and multiple ASSIGNMENTS, but ASSIGNMENTS are or can be separate from ORG_CODE.
- You can avoid 4NF by building your tables with 2 rules:
- All attributes must be dependent on the primary key, but they must be independent of each other. *No row may contain two or more multivalued facts about an entity.
Denormalization
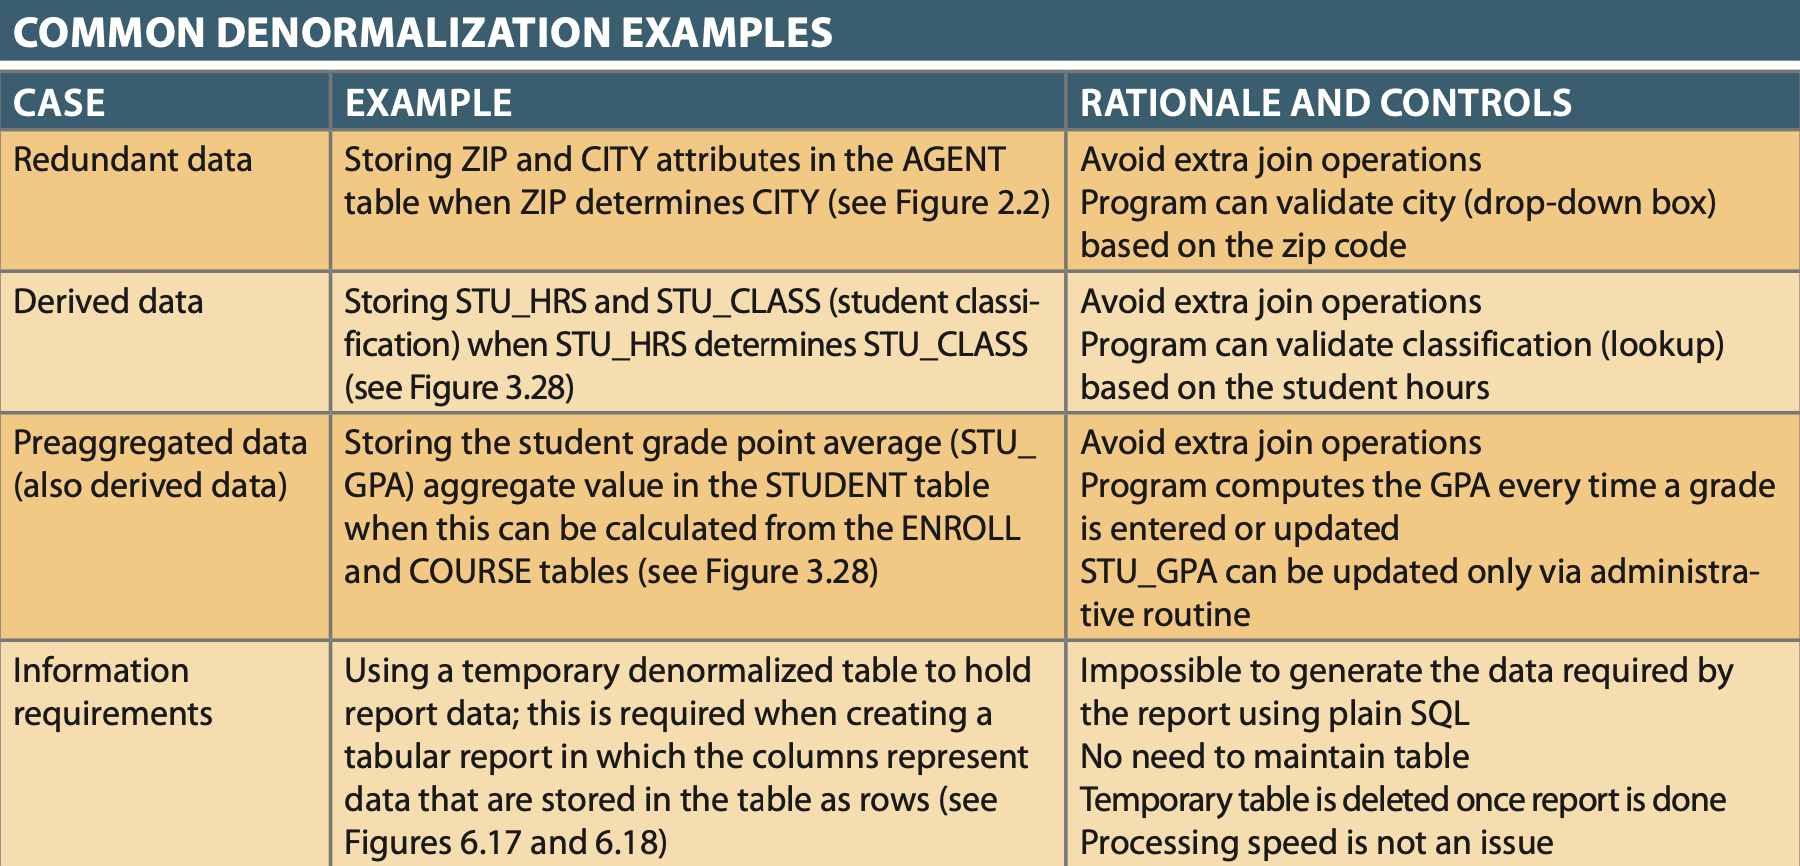
Problems with Denormalization
- Data Anomalies like:
- Update Anomaly: e.g. Updating CLASS HOURS but multiple rows have a reference to the HOURS attribute, so many updated rows are necessary.
- Delete Anomaly: e.g. delete last STUDENT in table associated with a CLASS also deletes historical knowledge of class.
- Insert Anomaly: e.g. Insert of STUDENT in a table requiring CLASS assignment requires a DUMMY class or a NULL
- Data updates are less efficient because programs that read and update tables must deal with larger tables.
- Indexing is more cumbersome. It is simply not practical to build all of the indexes required for the many attributes that might be located in a single unnormalized table.
- Unnormalized tables yield no simple strategies for creating virtual tables known as views. You will learn how to create and use views in Chapter 8, Advanced SQL.
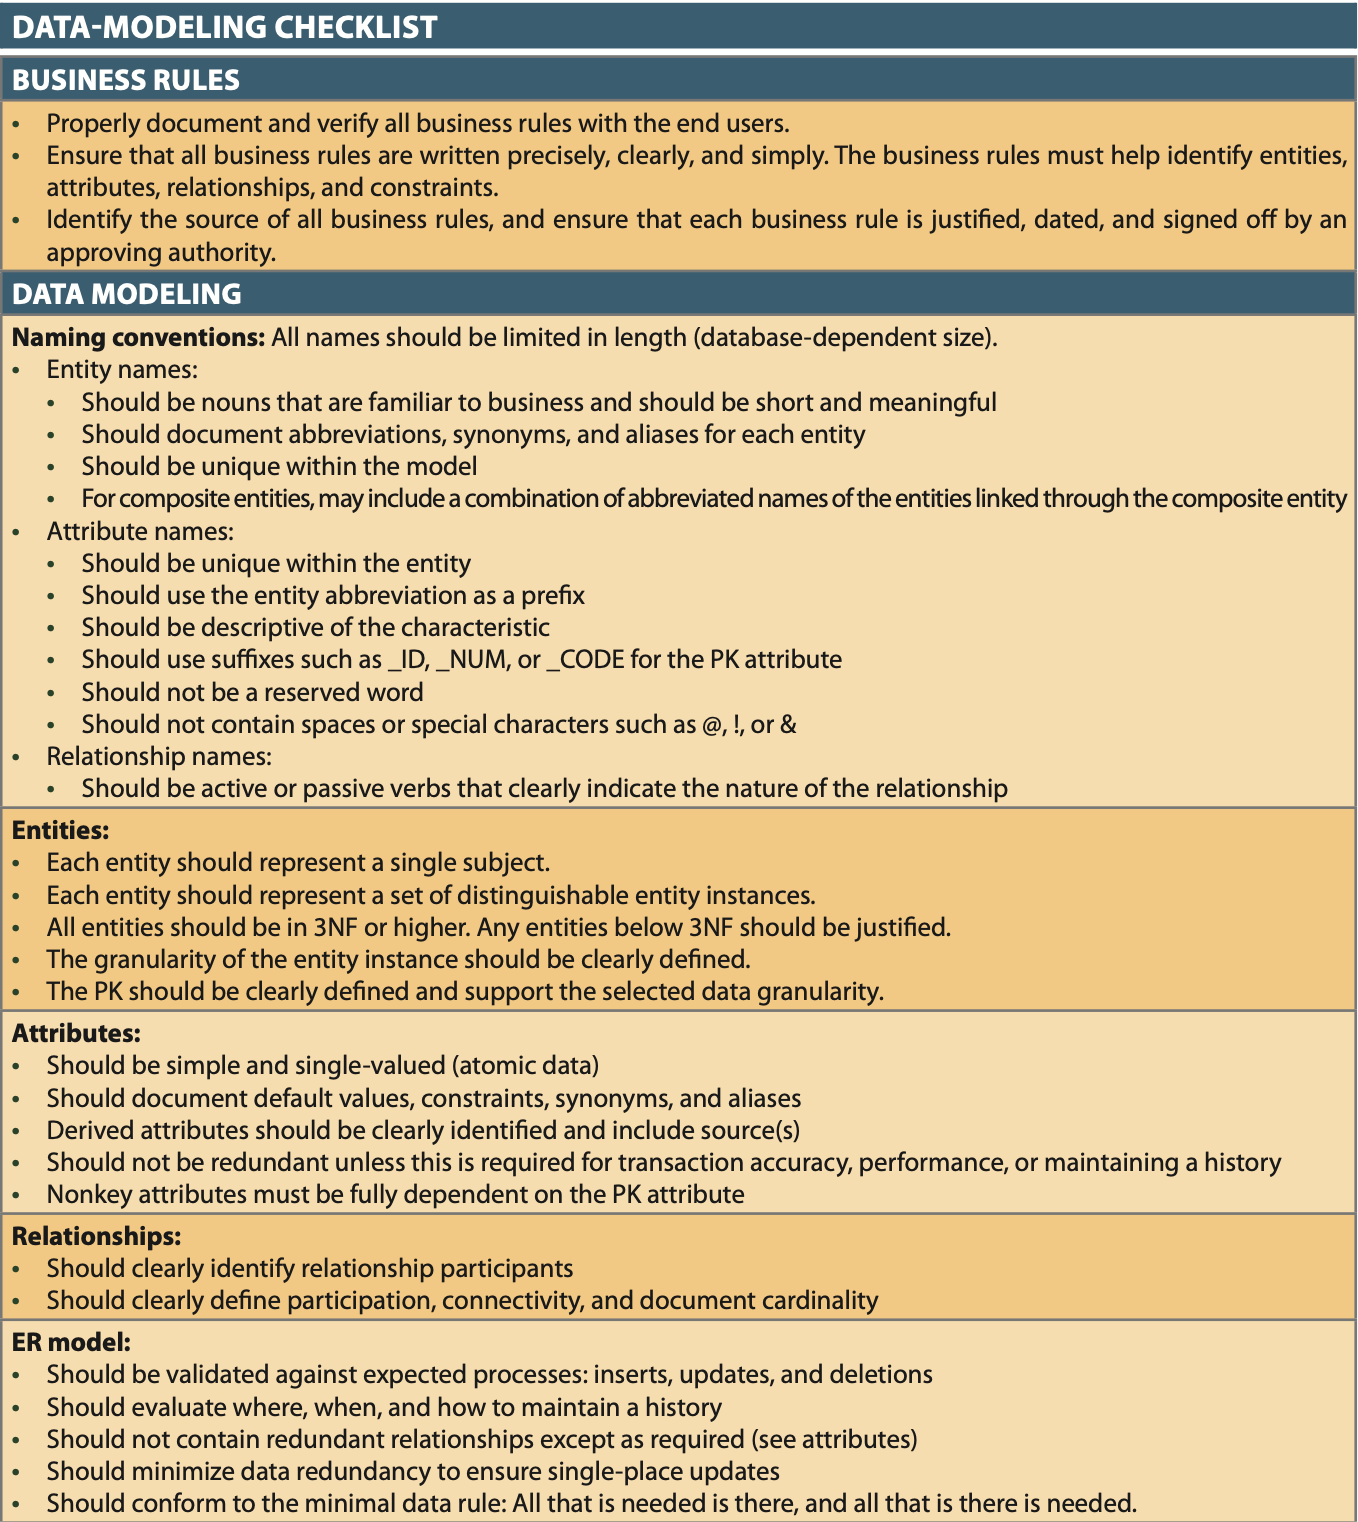
Minimum ERD Data-Modeling Checklist
- Help yourself, follow the process.